The M in the name “MSLA resin printer” stands for “masked.” These printers use either an LCD or DLP chip to mask the UV light to create a pattern for the layers. UV light is often created by LED diodes. When you look at the portfolio of resin printers, the manufacturers bring new and new arrangements of LED diodes and corresponding optics. They use claims like “99% percent uniform backlight” and “even more parallel rays” in their marketing materials.
This makes one wonder – are these claims factual or just marketing? Which light source is the best? And should I even care? Can I see the backlight quality on the quality of my prints? Let’s find out.
In this blog post, I will show you how you can measure the quality of the backlight using two open-hardware and open-source measurement jigs I designed (called DrLCD). We will also use these measurements for compensating some of the imperfections via building LCD compensation masks. We also discover how much a backlight can affect your print quality and precision. You will also learn how you can use DrLCD for measuring the health of your LCD display, and we put some measurements behind the question you see on the Facebook groups often: “how long do the LCD displays on a resin printer last?”
Theory 101: What is the ideal backlight?
For simplicity, I will focus here only on LCD printers. They are also more widespread compared to DLP printers. The same challenges, however, apply also to DLP printers. They just have a slightly different optical arrangement, and the optical defects come from other parts of the optical chain.
Let’s look at the ideal case from the following image:
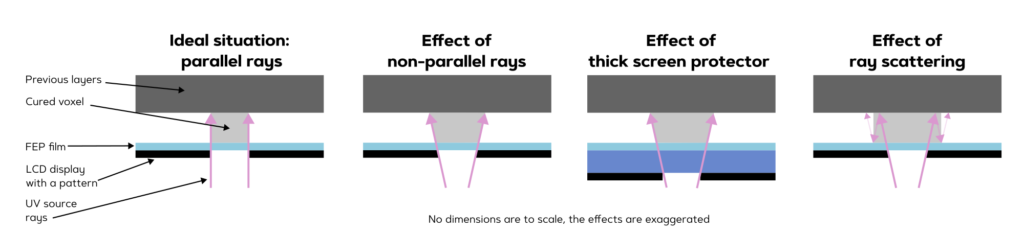
The ideal case is when we have perfectly parallel rays and an even amount of backlight. In that case, the pattern projected by the LCD gets precisely reflected into a cured resin. Just a quick reminder from high-school physics: we only need to draw the side rays to get an idea about the exposed pattern; the light is uniformly spread.
However, once the rays aren’t perfectly perpendicular to the LCD, the voxel slightly overgrows as the light exposes resin over the edges of the LCD pattern. How much depends on the layer thickness and the rays spread. To get at least a rough idea about the overgrowth, it is $t\cdot\sin\frac{\phi}{2}$, where $t$ is the layer thickness and $\phi$ is the spread angle of the rays.
However, once we increase the distance from the actual masking element – the LCD – we have to add this to the layer thickness, as illustrated in the third case. This was noticeable mainly on the original Mars. Once you removed the glass from the LCD, you got much crisper prints and better dimensional accuracy.
Meanwhile, these effects are easily noticeable and verifiable via direct experiments; I conjecture that there is another effect in play. So far, we haven’t discussed how exposure affects print accuracy. This effect is noticeable, and I guess everyone has seen an over-exposed test piece. I believe that light reflections and scattering explain this. However, at the moment, I cannot prove by an experiment that this is indeed the proper explanation. Nevertheless, the conjecture is:
The light has a tendency to reflect and scatter on the pigment in the resin (no matter if uncured or cured resin). So we actually get exposure to UV beyond the area masked by the LCD. The reflections are subsequently weaker and weaker until they are weak enough to trigger curing. However, they cause overgrowth just like antialiasing does. There is an effect that the resin needs a lower UV dosage to cure if it touches already cured resin. This effect was shown by Autodesk, and it is well explained in the following video directly by them:
This scattering effect depends on the resin, and it is nicely noticeable on Siraya Tech Fast Mecha. The scattering explains why we see over-growth on over-exposed models. If there was no scattering and the rays were parallel enough, no overgrowth would be noticeable. This effect is often called “exposure bleeding.”
Based on these observations, let’s sum up the effects of backlight quality on printed models:
- The less parallel the rays are, the bigger overgrowth we observe (and thus, loss of details).
- The more material we stack between the resin and the LCD, the bigger overgrowth.
- Due to scattering, a change in exposure leads to a change in size.
- Change in exposure is also noticeable when printing overhangs, as shown in a previous blog post.
- The less parallel the rays are, the more noticeable scattering is.
Now when we should understand how the backlight can affect print quality, let’s actually measure how good it is. Note that for most applications, we don’t mind imperfect backlight if it is consistent across the whole print volume. If it is consistent, we already know how to compensate for exposure bleeding and other effects. When they are not consistent, the amount of compensation depends on the position of the model in the printer’s build volume.
Measuring rays parallelity
I struggled for a while with measuring how well the rays are parallel. I finally have a working and nice solution for that. However, I have to give credit to Reddit user RaukkM, who came up with this method first.
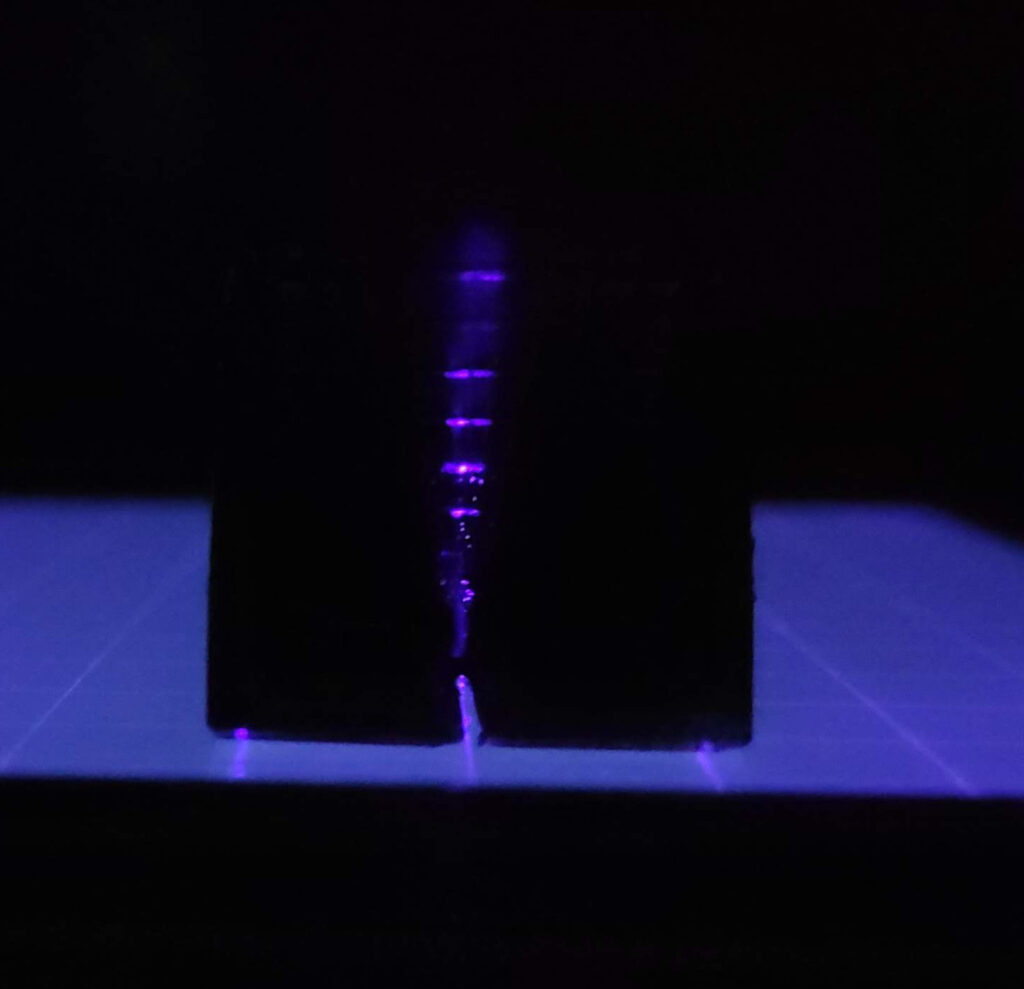
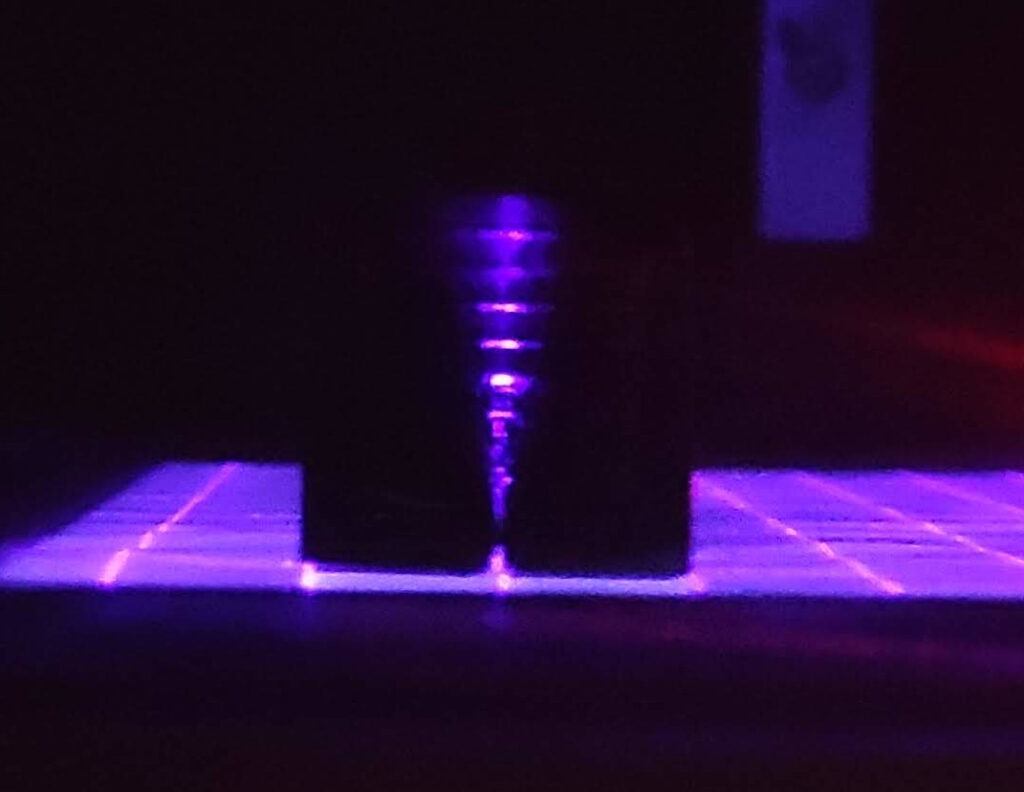
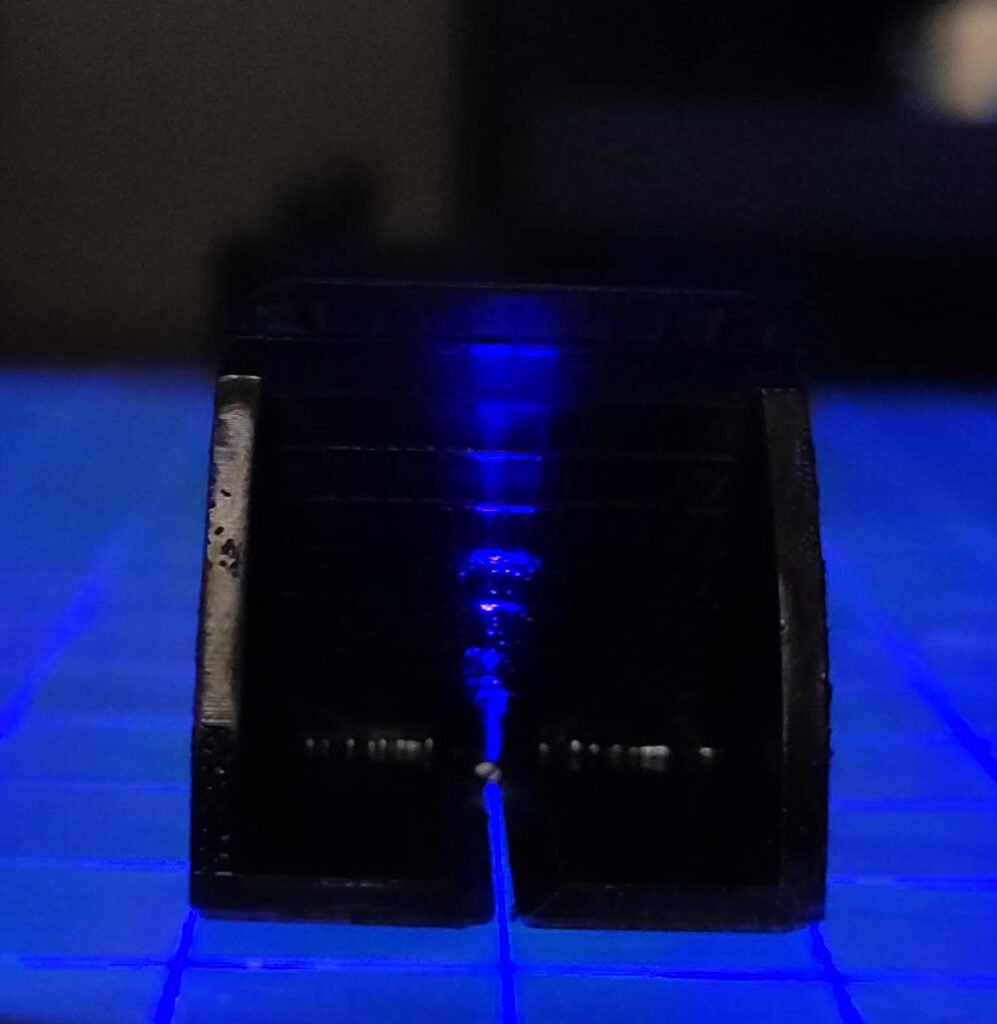
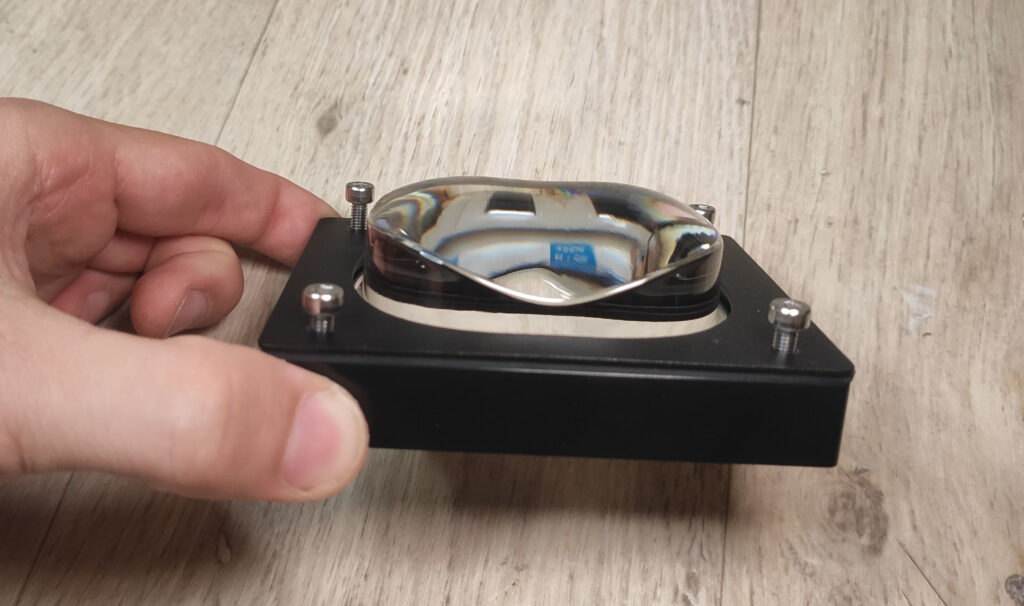
The method is based on displaying a single-pixel wide line on the LCD and putting a projection plane over it tilted by 45°. Then you can nicely see the cone of light. By using small marks on the test piece, you can also quite precisely read the angle $\phi$.
To apply this method, simply download and print the test pieces (ideally, on a resin printer as FDM cannot print the angle marks):
You can also download the models on Printables.
Then you need to display a single pixel line on your display. To do so, I provide an UVTools script. Simply take any sliced file for your printer, load it into UVTools and run the script. It will create a grid pattern. The already sliced file is needed to get the parameters of your printer. In this way, you don’t have to specify anything. Then, remove the build plate and resin tank from your printer. Now you can “print” the grid file and place the measurement piece over a single line. Note that based on the backlight used, different lines might give you a different pattern (e.g., the light is more spread on the sides than in the center of the display).
At the moment, I struggle with capturing the pattern on camera as the scene is high-contrast. Also, reading by eye isn’t the most comfortable. To do so, I tried printing the measurement pieces in Siraya Tech Glow resin. You simply let it expose for a few seconds, take it, and look at where it glows. If we wanted to properly examine the cone patterns, it would be worth it to attach a photo-reactive paper to the piece and capture a “photo” of the pattern.
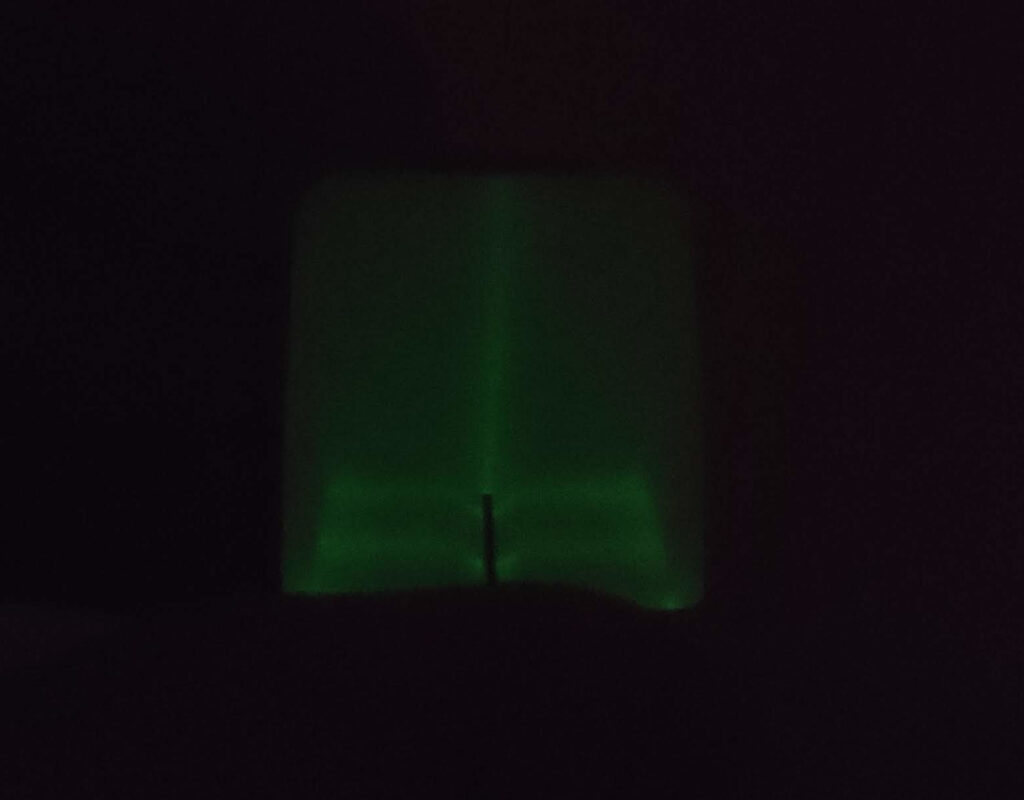
Experiment with capturing the cone via glowing resin
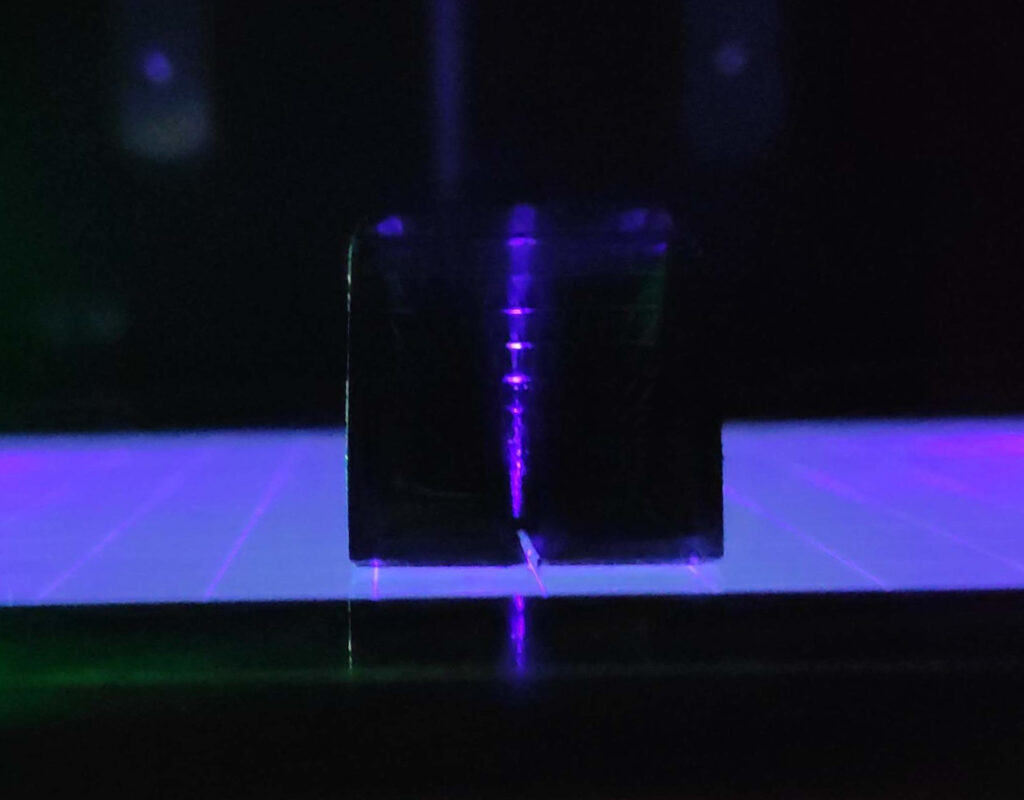
Saturn 2 in the middle
Saturn 2 on side
Saturn 1
Peopoly Forge
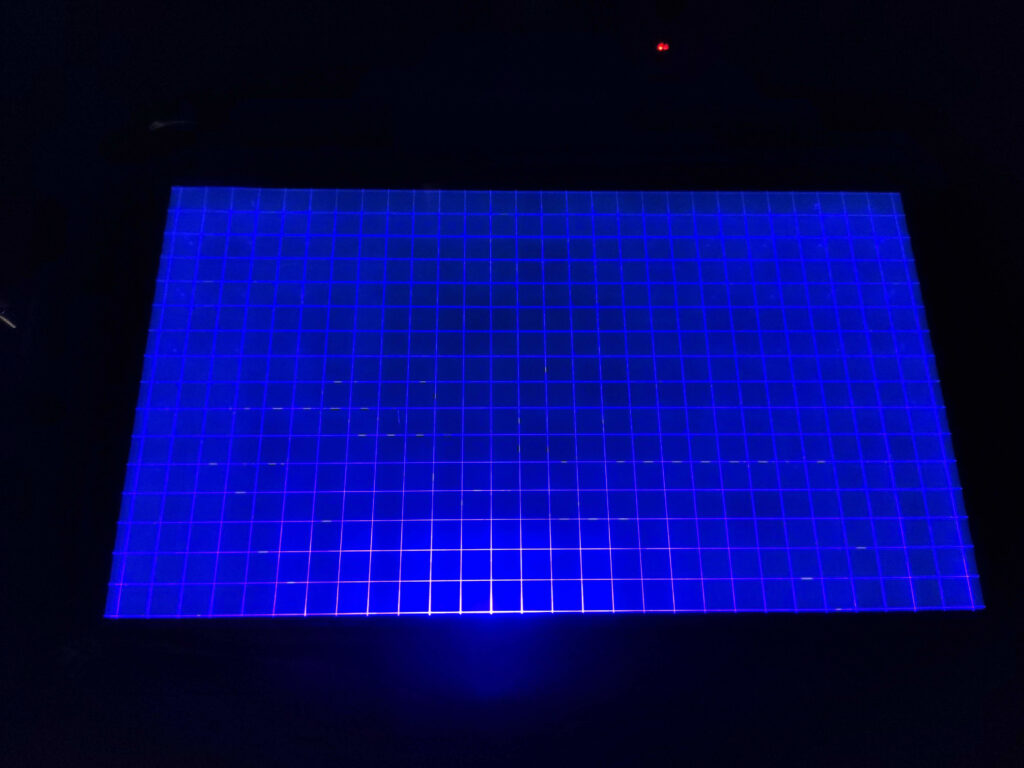
Test pattern
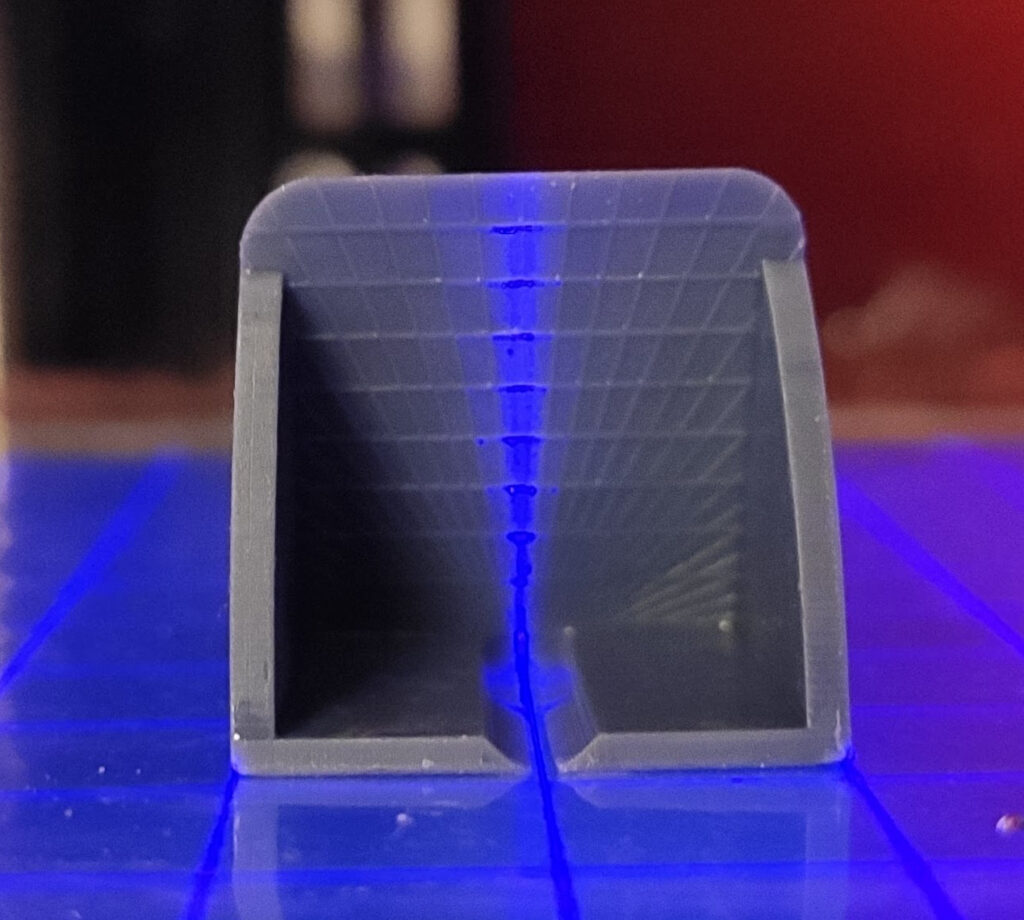
Measurement jig in action
However, I didn’t explore the possibilities of capturing the cone as it seems that all the modern LCD printers I own have quite a good parallelity of the light.
- Elegoo Saturn has an array of LEDs with a lens in front of each LED. I measured the cone angle between 4-7°. The angle seems to vary based on whether the line is in the middle of the lens or the border. That means that scattering can cause an error at most 12 µm (if considering 50µm polariser and 100µm FEP film of the tank and 50µm layer height).
- Elegoo Saturn 2 has a single LED in the bottom and a fresnel lens directly in front of the LCD. In the middle, the cone angle is 2°, and it enlarges up to 4° to the sides of the screen. That means a 7µm error in the same setup.
- Peopoly Forge has a similar arrangement to the Elegoo Saturn. However, the angle seems to vary between 6-10°. That means up to a 17µm error.
- The original Mars (based on RaukkM’s images) has a really interesting pattern. It has several beams. The strongest middle beam has an angle of 14°, but there are side beams with angles up to 35°. Considering only the middle beam, we get a 28µm error in the considered setup. However, considering the original protective glass, we get an error of 130 µm. No wonder the original mars performed so bad!
Based on these measurements, we see that the parallelity isn’t perfect, but unless it triggers scattering, it is negligible as it is in the order of pixel fractions.
Measuring the backlight – DrLCD
The other source of possible inconsistency across the print volume might be the uneven backlight. As we learned, due to light scattering, the prints tend to overgrow when they are overexposed. If the backlight is not even across the screen, some parts of the model will be under- and some over-exposed, and thus, their dimensions will differ.
There have already been attempts at measuring the backlight by Photonsters. They used a photoresistor connected to Arduino to measure backlight intensity on a given point. To get spatial data, they used a 3D-printed mask, where you had to manually move the sensor. This not only provided not enough data but also was very laborious. And it only works for a fixed printer size.
This wasn’t an approach I wanted to follow. I like fast, autonomous, and replicable solutions. Therefore, I decided to build and universal measurement jig. One obvious solution is to use an array of sensors. However, such a device would be pretty expensive and hard to design properly. Therefore, instead, I decided to use a single sensor on a movable platform that we use for scanning. The platform should be easily attachable to a removable from the printer. It should also fit various-sized printers. We should also support multiple sensors.
The final device is called DrLCD, and you can see the finished device in the gallery below. If you are not interested in the details about the measurement jig, feel free to skip the rest of the section and directly look at the measurements.
Movable platform
Since the platform should support various sizes of printers, we cannot make a simple XY gantry. Therefore, the ideal setup is to have a long X rail mounted on the front of the printer and an arm that reaches inside the printer volume. It is also desirable if the motors are static as it can make the whole construction simpler (and minimizes the mass that moves). After some fiddling, I came up with the following arrangement:
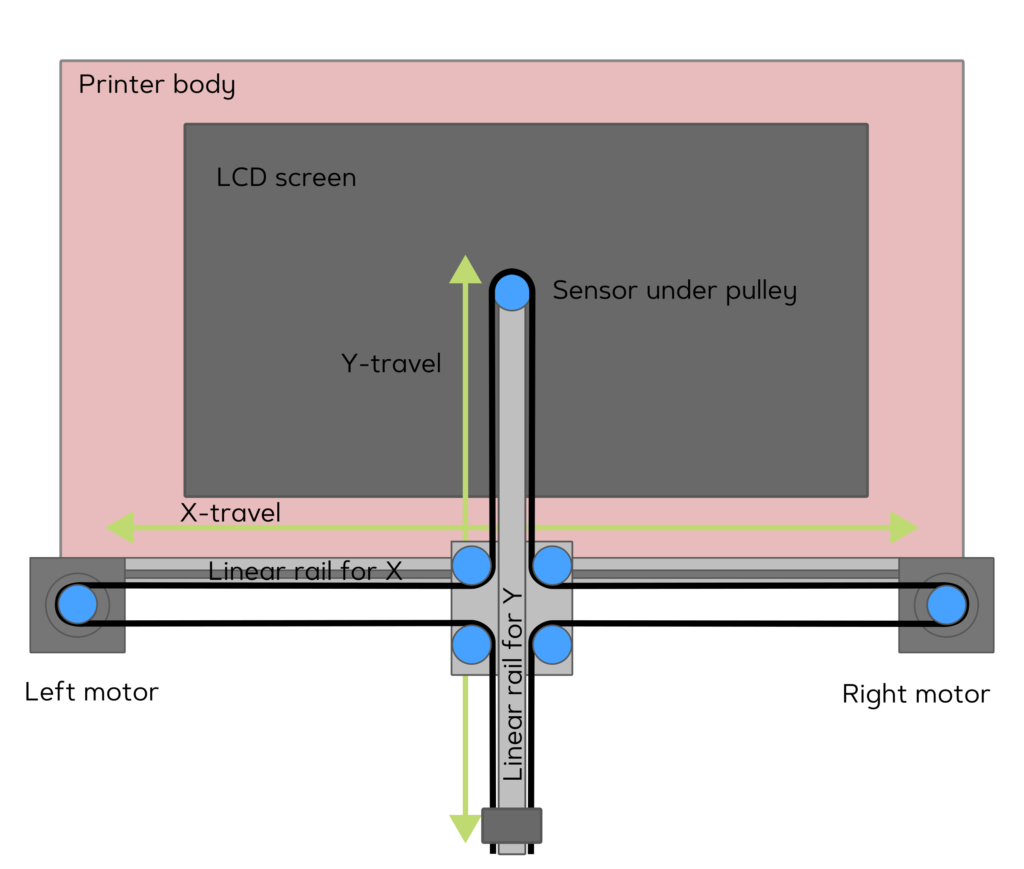
This arrangement allows for mounting to the front printer, and it doesn’t mind any resin tank mounting points. It also features two static motors. This arrangement also follows standard CoreXY kinematics. You can see how it works in a video of one of the very early prototypes:
Choosing sensor
Another aspect of measuring the backlight is selecting the right sensor. I went through a large number of datasheets, and I made the following list of suitable sensors:
- TSL2561 is an old and deprecated luminosity sensor. However, it is simple to use and has usable sensitivity of 405 nm (about 60 %). The good thing is that it has an integrated amplifier and ADC, and it is calibrated by the factory, so different sensors should give the same reading. Fortunately, despite being deprecated there is still easy to buy a dev board.
- ML8511 is a sensor with perfect UV sensitivity. It is cheap and commonly available. It has an integrated amplifier, so it outputs an analog value. The only downside is the large active area.
- GVBL-S12SD is the photodiode used by the recently introduced Chitu light meter. It is only a photodiode, and you have to add an amplifier to it. Therefore, using it would be nice for direct comparison, but it needs extra development effort.
These sensors measure the intensity across a broad spectrum. However, for research purposes, it would be nice to also be able to also get spectral information. For that, there are two candidates:
- AS7341 is a spectrometer on a chip. However, it is aimed at the visible spectrum, so only the lower three channels reach the 405 nm range.
- There also exists AS72653, which is a wide-range spectrometer on a chip. More specifically, it is three chips offering 18 spectral channels. With this chip, we could get about 5 channels to reach at least a little bit in the 405 nm range. However, it requires all three chips. Thus, the solution is large and expensive. And probably it won’t perform well.
After careful consideration, I decided to support TSL2561 and also offer support for AS7341 and ML8511.
Technical solution
The goal with DrLCD is to offer something that can be easily and quickly built from commonly available components. It is also a primary measurement jig and not an end-user device, so some rough edges in the usage and workflow are tolerable.
The whole mechanical construction is based on MGN7 linear rails and MakerBeam aluminum profiles. They form the basic construction that attaches just like a wood clamp to the printer. The custom components can be printed on FDM or a resin printer. I use common Nema 17 stepper motors for driving the belts. For controls, I decided to reuse one of the dirt-cheap FDM printer controllers board running Marlin and just connect the sensor to it on spare pins and write new G-Code commands for measurement.
The processing is handled by a computer connected to the board via USB. The whole measurement orchestration and data processing is done in a small Python script.
The source code is released under GPL license (to respect the license of the Marlin firmware). I also plan to offer the CAD model of the mechanical construction so anyone can build and use it. Currently, my Patreons and GitHub sponsors have access to the initial model. The model needs to be polished a little and needs documentation before I can release it completely.
The whole project is available on my GitHub. You simply print the pieces and assemble them according to the CAD model. Then you flash the firmware to the board (the easiest method is via SD card), install the control software on your computer using pip install git+https://github.com/yaqwsx/DrLCD.git and you are ready to make measurements.
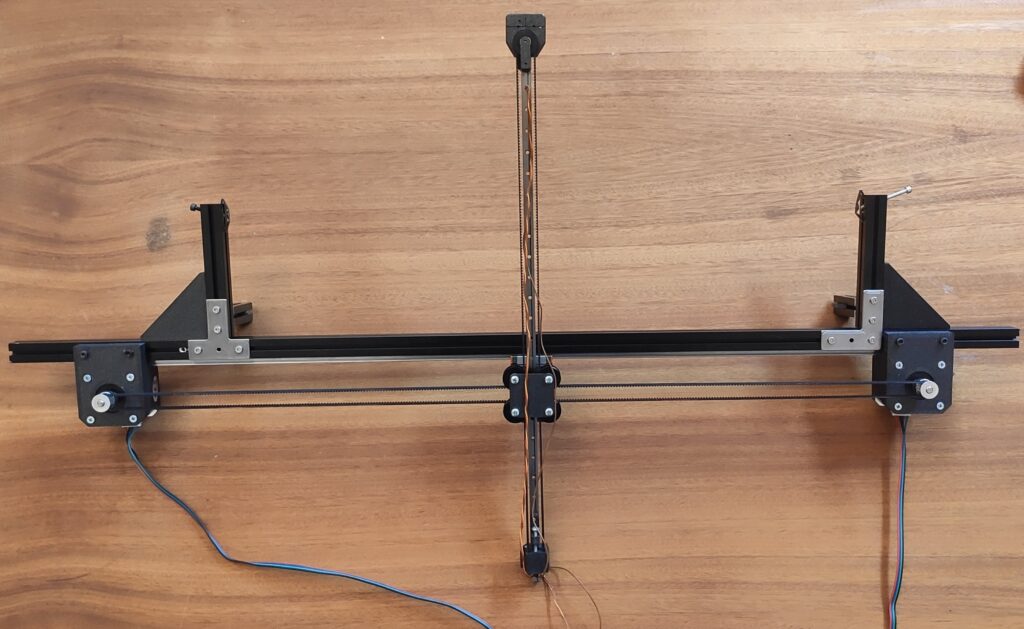
The finished device
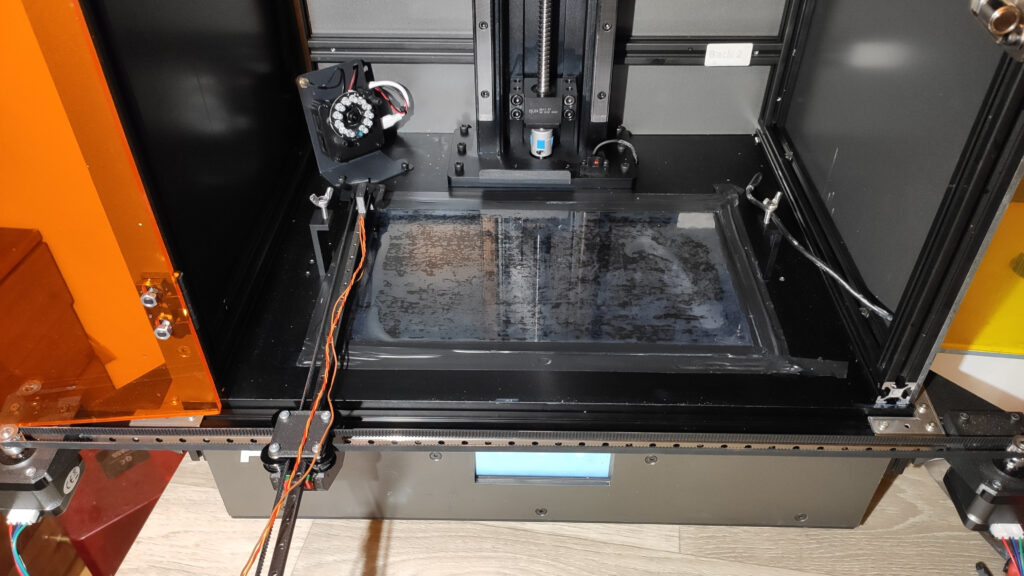
The device mounted on Peopoly Forge
What does the backlight of various printers look like?
So let’s use DrLCD to measure the backlight of our printer. You start with mounting the board to the front of the printer. Then you manually move the head outside the top left corner of the LCD. Then you run the following command on your computer:
drlcd measurelcd --size <display_size_in_mm> --resolution <number_of_samples> --fast <output_file>
# E.g. drlcd measurelcd --size 202x130 --resolution 202x130 --fast frist-saturn2-mesurement.json
This command will scan the LCD and save the result into a JSON file, just like you can see in the video below. The scanning process for a 1mm resolution takes about 10 minutes on Saturn 1. I recommend you prepare a full-white sliced file with a single layer and long enough exposure.
If you want more precise, you can omit the switch --fast. In that way, the jig will stop for measuring in each sample. This gives, to some extent, higher resolution, but the measurement takes much longer (e.g., Saturn 1 takes 65 minutes to complete), and the gains are negligible.
Then we can use the command drlcd visualize --show --title "<graph name>" <measurement file> <output HTML file> to visualize the measurement. It will generate an interactive HTML page. The --show option immediately opens it in a web browser.
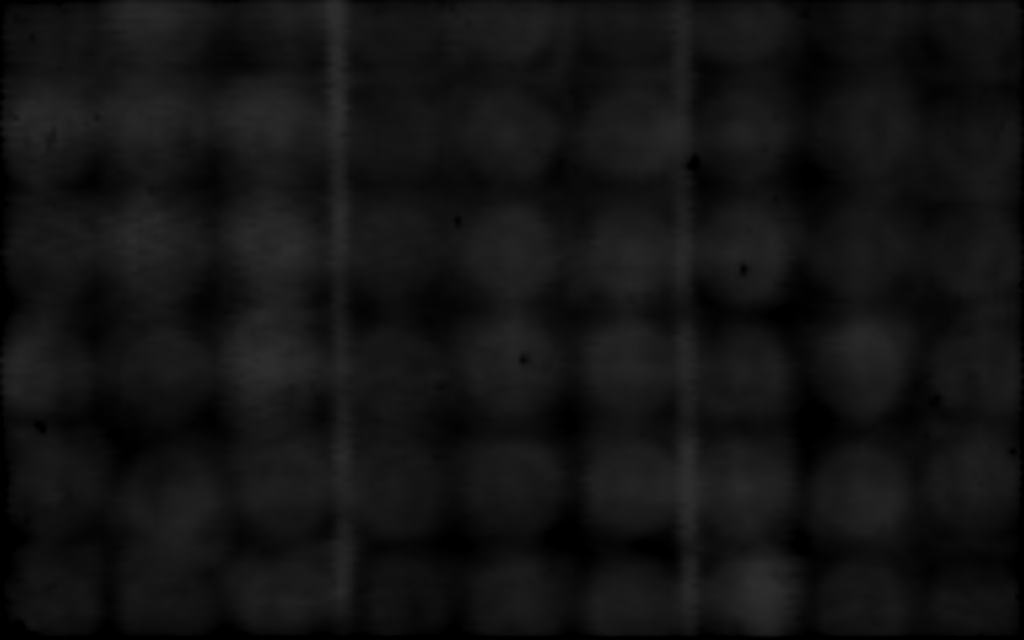
First of all, I tried to scan my old Saturn 1 with a 3mm resolution. The results look great! See for yourself:
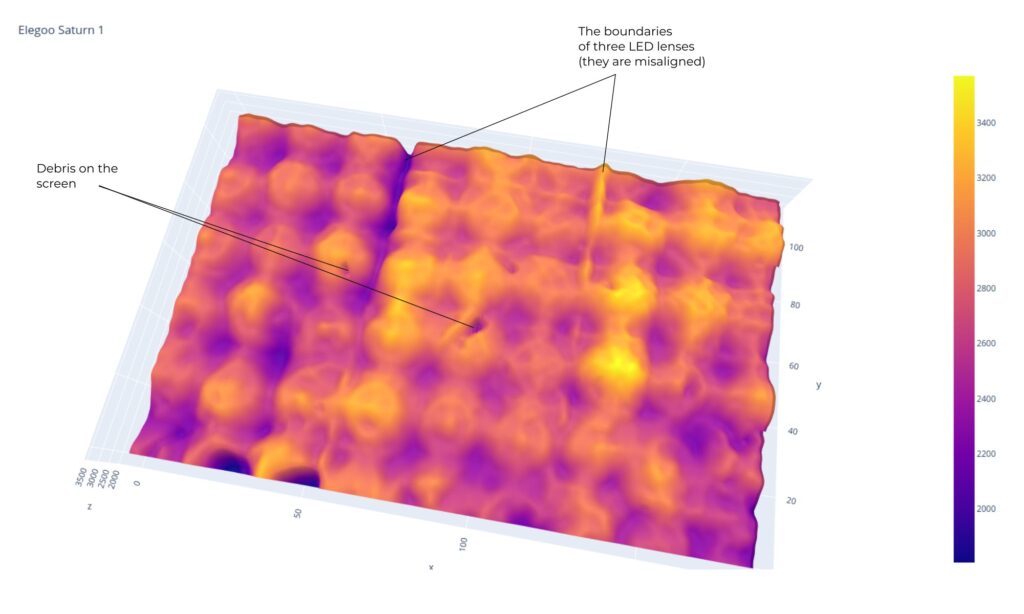
You can nicely see the individual LEDs with lenses. You can also see debris on the screen, and also, you can see that the LEDs don’t have the same intensity. After tweaking the device, I made the following measurements. This time with a 1mm resolution. Note that the diagrams are interactive and you can rotate them, zoom them and make measurements on them:
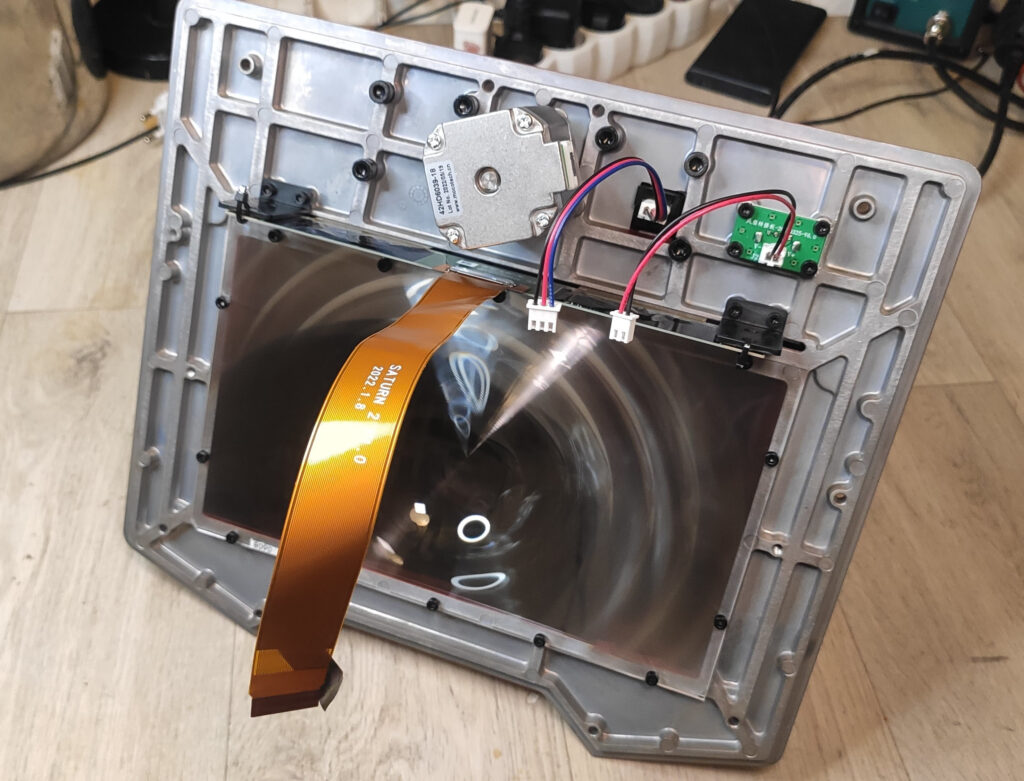
What bothered me were the inter-lens patterns and the dark area in the top right corner. Therefore, I disassembled the printer (as you can see below), and I found out that there was a small resin leak. Some of the resin made the lenses dirty, and since the resin is UV-blocking, it formed two dark spots in the corner. Also, the resin got into the gap between two lens panels which caused the dark area.
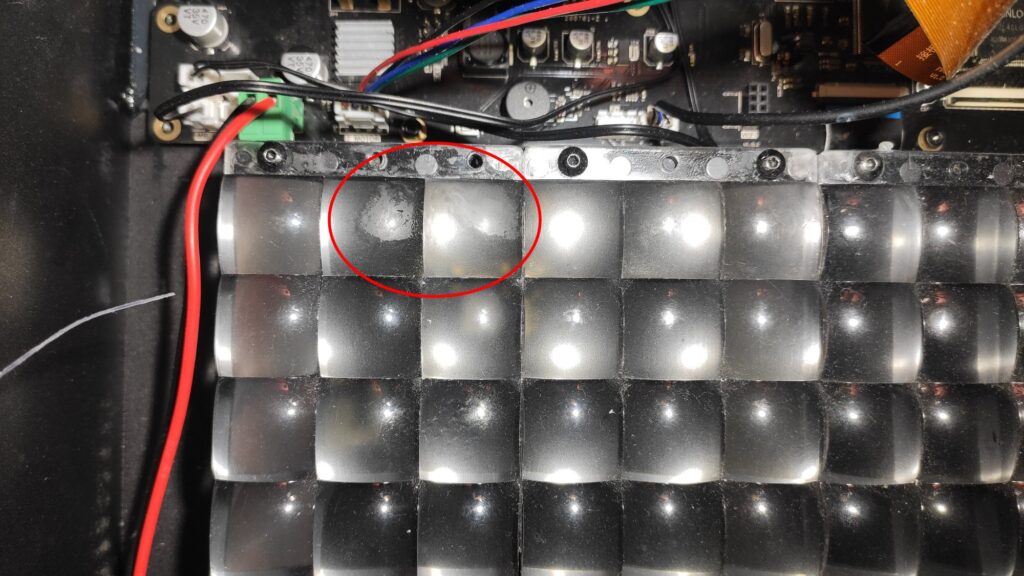
The dirty lenses causing dark spots
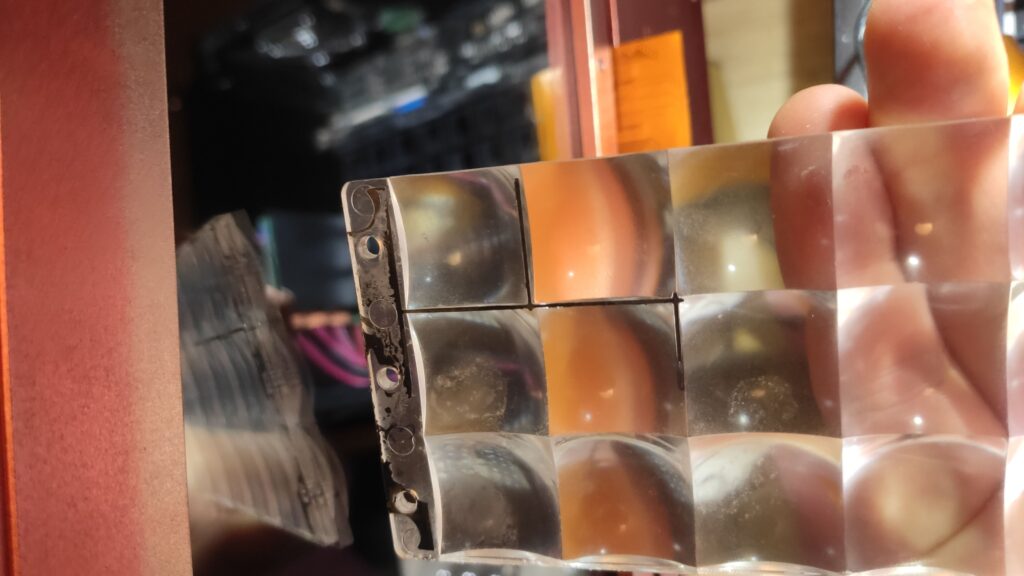
The dirt on lenses caused by resin leak
I cleaned and polished the lenses, and I repeated the measurement:
Much better! I still made the measurements with debris on the screen (as they are not easy to remove, but more on the experiment produced in another blog post). The uniformity of the screen is 34% (the difference between the darkest and brightest points, excluding 10% outliers on both sides). There is also a problem with areas where two lens arrays meet. There is no gap, but the light is reflected such that these lines form hot spots.
While I was cleaning the screen, I tried to take a measurement without the lenses:
Note that the hot spots aren’t the LEDs, but the areas where the backlight of 4 neighboring lenses overlap. Surprisingly, the individual areas are nice and flat. So if the grid between the LEDs was taller and ended just in front of the LCD, the backlight would be much more uniform, however, at the cost of a bigger ray cone angle. This angle could be reduced by placing the LEDs further away, but then we would waste most of the LED power.
The printer manufacturers also claim that they feature LCD with a high contrast ratio. To measure it, I display a chessboard pattern on the LCD and make measurements. Then we can compare the backlight of white and black squares:
For Saturn 1, the white squares have a brightness of 2950 units, the dark areas around 55 units, and the outside-LCD area 14 units. This gives us a contrast ratio of about 1:75. Whether it is low or high, I cannot judge.
Next, I measured Saturn 2 with its interesting arrangement of one large COB LED, a weirdly shaped LED lens, and a Fresnel lens in front of the LCD. The pattern is quite interesting. It shows some defects on the Fresnel lens, but overall, the uniformity is quite good – 22 %. We can also see that it is roughly 20–30 % brighter than Saturn 1, which is coherent with the lower exposures I need on Saturn 2 compared to Saturn 1.
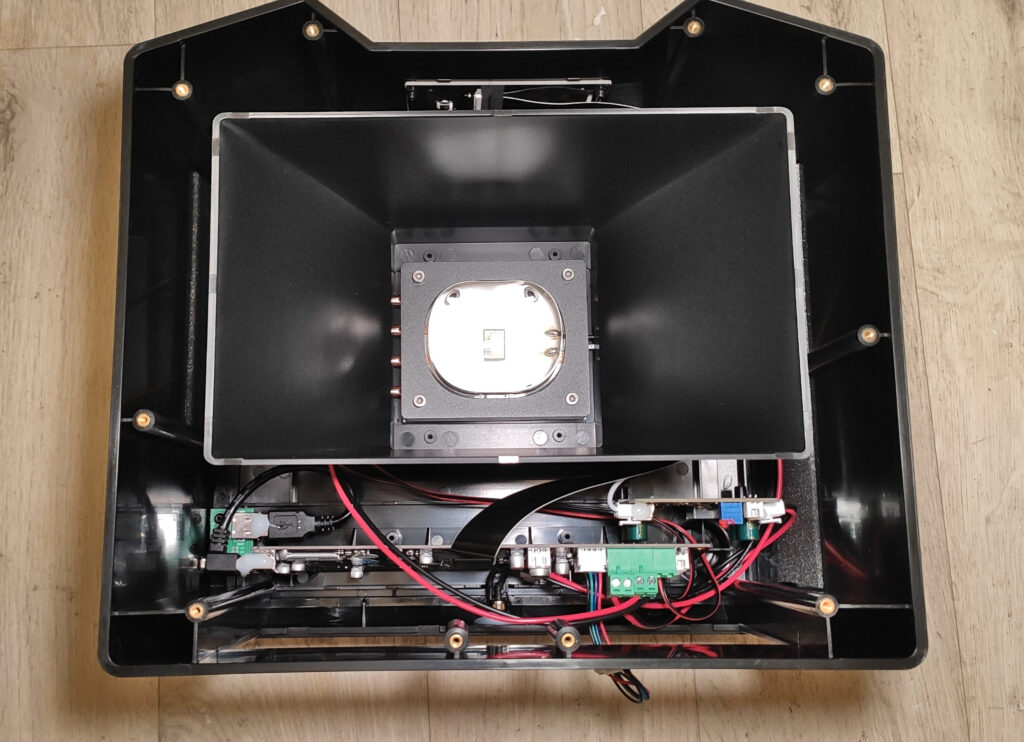
Saturn 2 light source
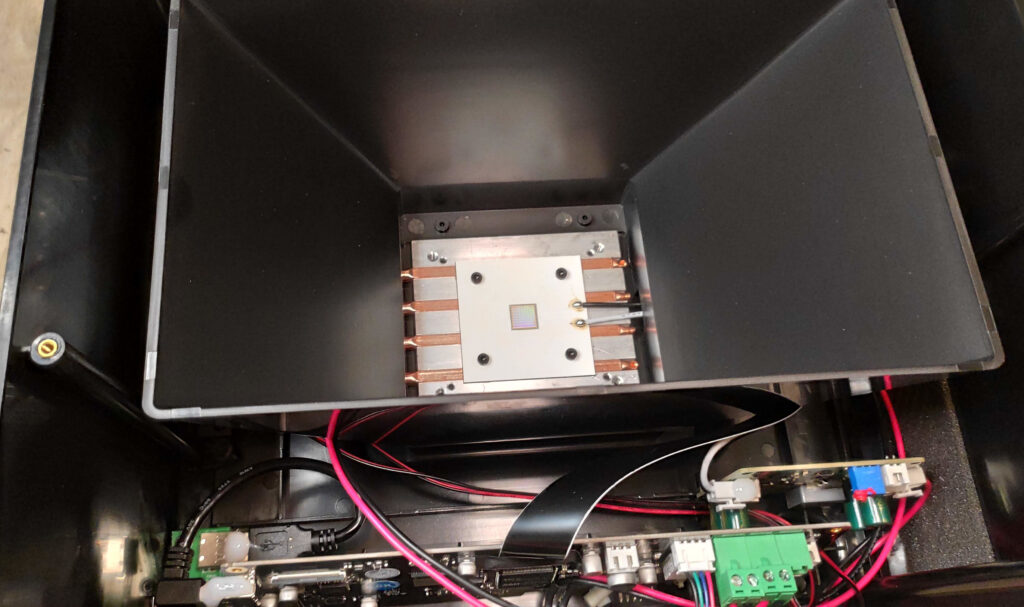
Saturn 2 light source
Saturn 2 light source
Saturn 2 light source
Last, I measured Peopoly Forge. It is nearly 2× brighter than Saturn 2, which is coherent with the very low exposure I use on that machine. Surprisingly, the LED array has an inverse pattern compared to Elegoo Saturn. This seems like the LEDs could be out of focus which would explain the bigger ray cone angle we observed before. But I haven’t explored this further at the moment. Please ignore the missing strip on the image. The Vlare board doesn’t allow me to specify long enough exposure time to finish it in time (there is an arbitrary 1000s limit on the exposure).
Compensating for defects in the backlight
Once we have these measurements, we can use them to compensate for the unevenness of the backlight by dimming pixels in the sliced image. To create a compensation map from a measurement, you can use:
drlcd compensate --measurement <measurement file> --min <low value to compensate> --max <high value to compensate> --by <amount of dimming> --screen <resolution in px> --cutoff <black value for screen detection> <output PNG file>This command will generate a compensation map like this:
A few notes about the arguments. DrLCD allows you to specify the low and high values for the compensation. This is useful if you have really tiny hot or dark spots. If you compensate for them, you will lose too much power on the LCD. At the moment, I let the user specify how much the values should be compensated. In theory, we could compute this value, but I have got the best results by manually tweaking.
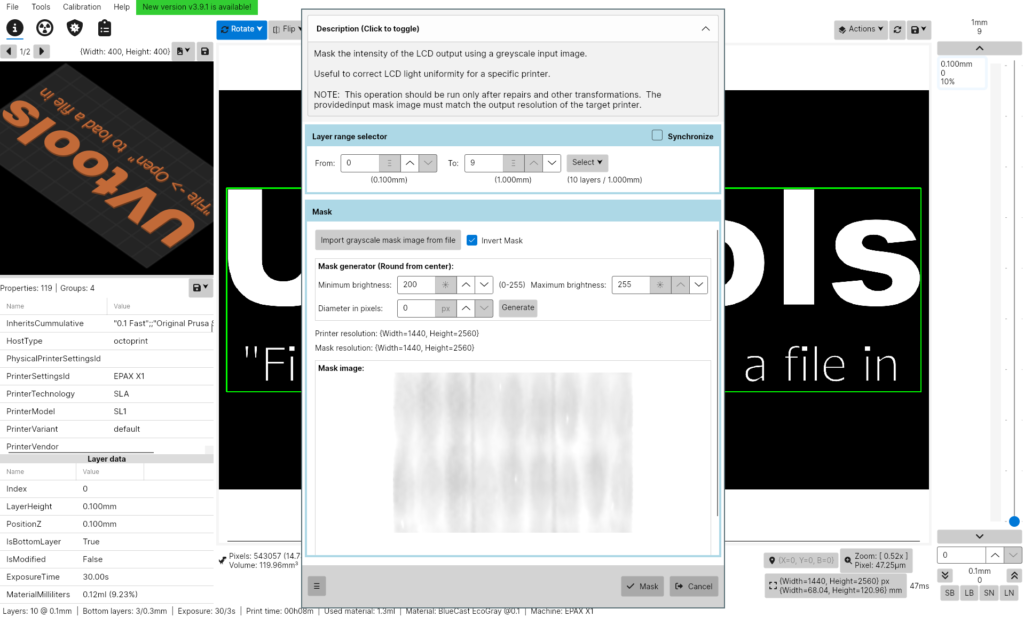
You can bake the compensation mask into a sliced file via UVTools under Tools → Mask. Here you can load the image. Be sure to check that the mask is an inverse mask. Some printers, like Peopoly Forge has functionality that you can upload this mask to the printer and it will automatically compensate the sliced files.
Note that the compensation bloats the files as the primitive RLE compression the Chitu printers use doesn’t work well with detailed grayscale images. I usually got double the size. If a slice is complicated, it also takes the Chitu board a while to load the sliced image (I saw a slice that took over 10s to load). This can slow down the printer. The Vlare boards shouldn’t suffer if you use the built-in compensation (I assume they implement the masking in FPGA). But I haven’t tested this yet.
With this procedure, we can compensate the backlight under 5% without losing much LCD power. We could do better, but then we sacrifice a lot of power (and also, a 1mm resolution isn’t probably enough for that). As we will see later, this already makes a notable difference.
Just for fun, I even tried to find a decent compromise to compensate for the Saturn 1 without lenses:
Measuring the effect of the uneven backlight
We got the backlight under control, but how much does it affect the print quality and dimensional accuracy? To verify this, I designed and performed the following experiment:
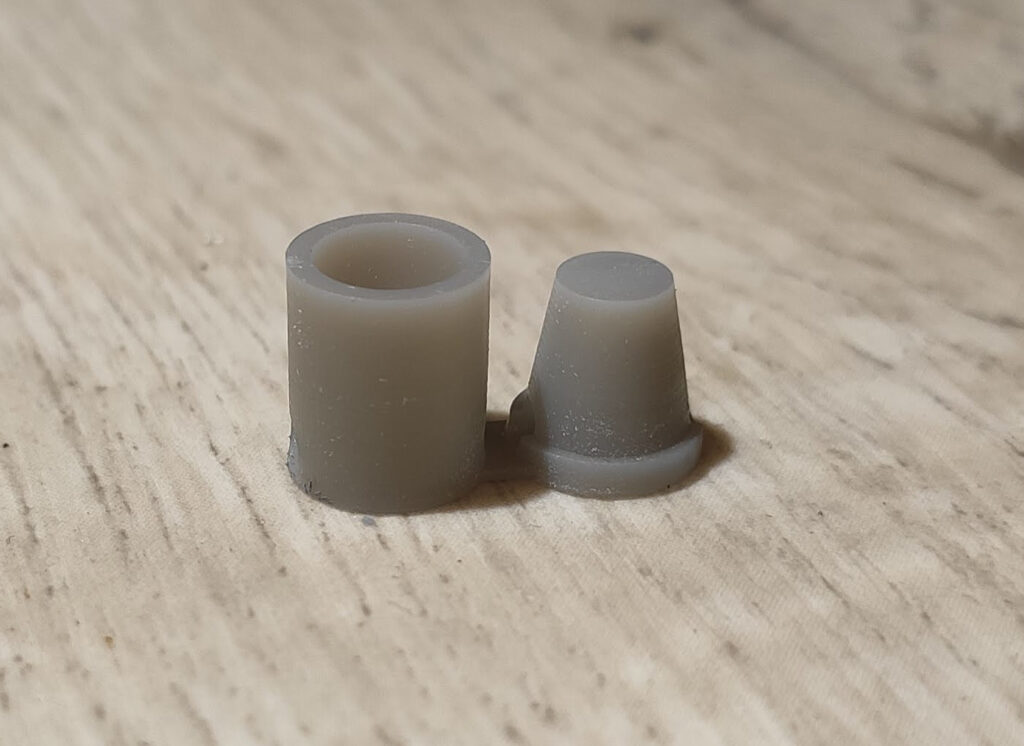
- I created a CAD model (see below) of the outside and inside taper with an angle of 20°. The model is designed to be printed flat on the bed, with vent holes and everything to eliminate blooming during printing.
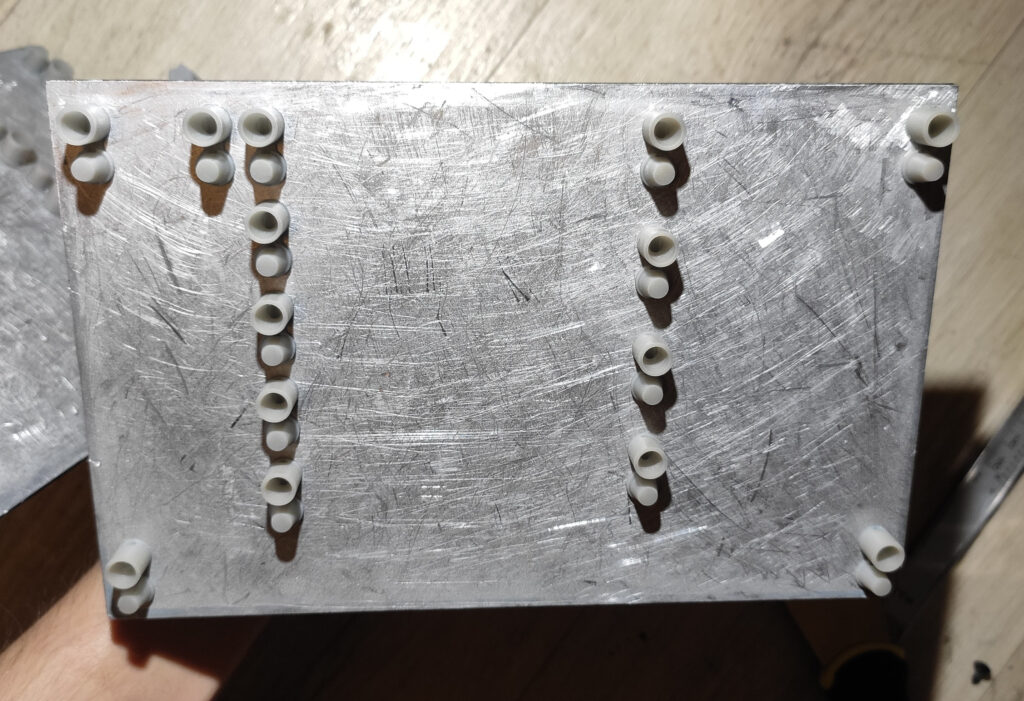
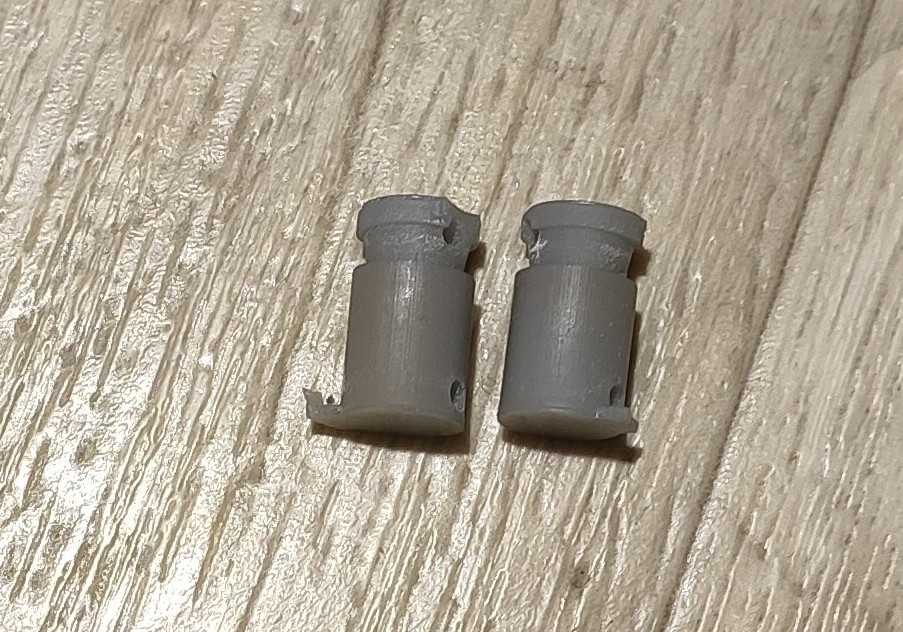
- I print multiple instances of the model spread across the build plate. Once without compensation and once with compensation.
- Then I wash and cure the model to get the biggest surface hardness.
- The corresponding pieces are assembled and hammered down (by throwing a steel cylinder inside a tube from a controlled height to ensure the same assembly force).
- Then I either measure the overall assembly length or the space between the taper bases.
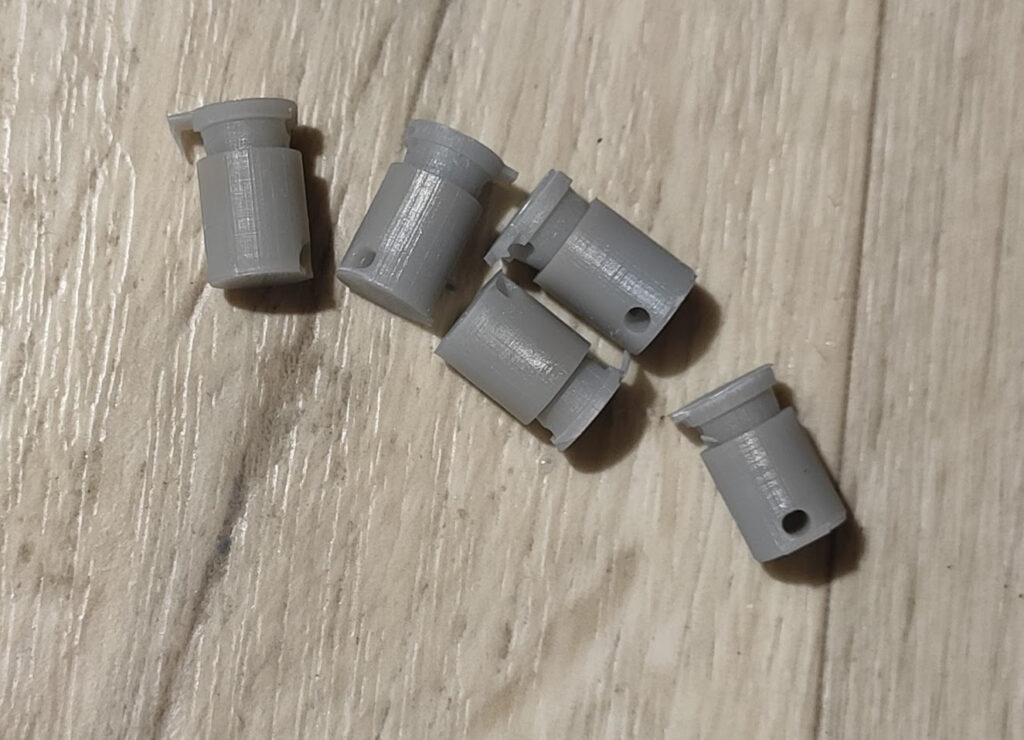
The hypothesis is that if the backlight affects the dimensional accuracy, the measured values will have a bigger standard deviation on the non-compensated batch. The usage of the taper has two effects:
- it captures growth in any direction (even when it is small)
- any inaccuracy in the XY dimension is translated to a 3× difference in Z measurement, so it is easier to measure.
I did a couple of experiments, and in all rounds, the hypothesis was confirmed. Another hypothesis that resins that suffer more from exposure bleeding (such as Fast Mecha) are affected more wasn’t confirmed. The results vary between resins, but I cannot find any pattern. Below, you can see the captured values from one of the experiments using a commonly used resin among my readers – Siraya Tech Fast Navy Gray:
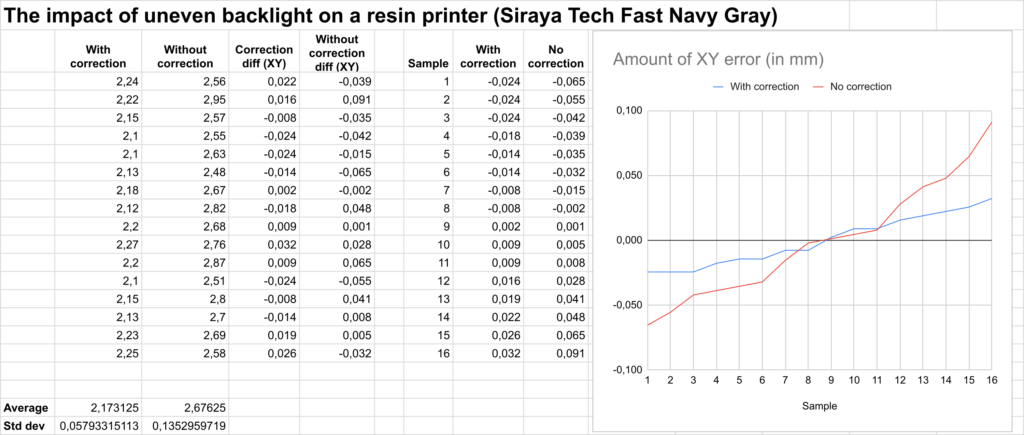
A perfect printer should form a horizontal line on the graph – that means there was no dimensional deviation between test specimens. Bigger the slope of the line, the bigger dimensional deviation among the test specimens. You can see that meanwhile the compensated bycklight yields specimens that fit within the range of 56 µm, the uncompensated specimens vary by 157 µm. So yes, there is a measurable difference on precision when using the compensated backlight.
Therefore, I think it is worth further experiment and run large number of samples of various resins and try to deduce what are all the variables in the process. That, however, requires some automation so I don’t have the data at the moment. If you have ideas and theories, please, share them in the comments.
Notes on the current state of DrLCD
DrLCD is nowhere near finished. There are still a couple of things I would like to implement that I describe later. However, even at the current state it proved to be useful and effective, so I decided to make it public early. If you try to replicate the project, please keep this in mind.
At the moment, the hardware and part of the software are ready for multiple sensor. However, I lack data processing for other sensors. All data I present here were measured with TSL2561.
Also, if you closely look at the measured data you can see left-to-right blur. This is given by the fast measurement method where the sensor is moving when it is measuring. Therefore, the image is slightly blurred to right for odd rows and slightly to left for even rows. This can be fixed by performing a deconvolution of the image. However, it seems that it doesn’t have a large impact at the results. But it is still something worth implementing in my opinion. If you use the slow measurement method, the problem doesn’t occur.
Conclusion
What we learned? First, that the backlight on MSLA printers matter and affects dimensional accuracy. There are two factors in play: rays parallity and backlight eveness. The rays inparalellity cases exposure bleeding and thus part overgrowth. It also make differences in uneven backlight where it makes the effects stronger. The uneven backlight does not only worsen cross-layer curing, but it also changes parts dimension in the XY plane.
Meanwhile there is not much you can do about ray parallity besides making sure there are no extra layers between LCD and the bottom of resin tank, you can measure the backlight using DrLCD and compensate for it.
If you have ideas on improvement or other interesting observations, please, share them in the comments!
Recent news: My open letter to the 3D-printing community
I love the 3D-printing community, but I think there is room for improvement. Let's get better in 2023! Read the full letter.
Support my work!
If you like my work (these blog posts, my software and CAD models) and you would like to see more posts on various topics coming, consider supporting me in various ways:
- You can become my sponsor on Github.
- If you prefer, you can also become my Patreon.
- You can buy me a coffee on Ko-fi,
- or you can buy something from my Tindie store (also see below),
- Or you can just share my work!
If you are interested in knowing what I am up to and recent sneak-peaks, consider following me on social media (Twitter, Instagram, Facebook).
My store offers
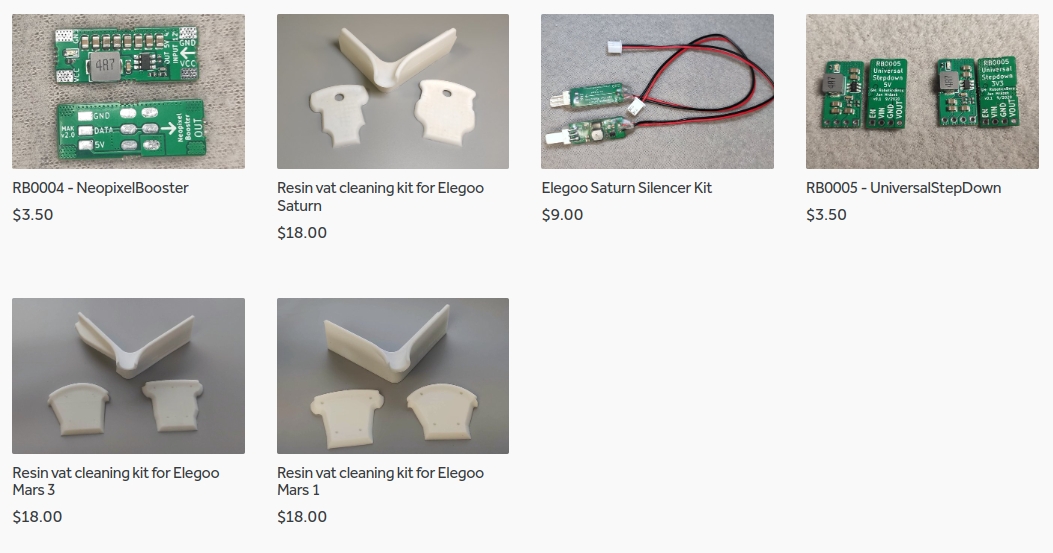
I launched new tank cleaning kits for Elegoo Saturn, Saturn S, Mars 1, and Mars 3. You can find them in my store.
Related Posts
- Multi-planar Slicing for 3D Printers – For Both FDM and Resin
- Open letter to the 3D printing community: Let’s be better in 2023! What should we do?
- Continuous Printing On LCD Resin Printer: No More Wasted Time On Peeling? Is it possible?
- Cross-layer Curing and Layer Bulging on Resin Printers: Enemy of Overall Dimensional Accuracy and Printed Threads
You should check out the cameras over at maxmax.com. They have good response in the “deep” UV region especially for their price point.
Hello, first off, amazing post, I noticed the patterns on my OG Mars but I never thought about actually measuring it 🙂
I’m assuming most printers would have similar “exposure maps”, at least when new. Do you have plans for a repository where we could contribute to and/or get the compensation file for specific printer models ? That could even be integrated into UVTools fairly easily I believe ?
I didn’t have plans for that. It could be interesting but based on my initial measurement and the fact that the companies often change components during production, I am not sure how much useful it would be. Especially when you cannot test if the applied corrected pattern indeed helped or made things worse.
Would be nice to see a measurement of the new anycubic m3 premium wich uses a concave mirror. Then compared to the saturn 2 wich looks very good already.
I have several of both Mars 3 and Mars 3 Pro printers. I have noticed through UVTools exposure tests that the 3 Pro requires more exposure time than the 3 for the same resin (and same temp/humidity, all printers are in the same room). I suspect the Fresnal lens on the 3 Pro (or, perhaps different UV LED power) is the cause for this. Did you happen to notice any power differences like this during your study?
It’s hard to tell optical power efficiency differences unless they both use the same raw LED and only different optics since most printers use different LEDs/wattages. But, I’d does make sense that better optics (light being more parallel) let less light through, because that’s just how optics work (something about entropy).
Jan mentioned that the Saturn 2 measured as stronger light than the Saturn 1, but they use different LEDs, so, the Saturn 2 LEDs might just be brighter/higher wattage.
Amazing post, and thanks for the shout out.
Those visuals are superb, great job.
Ironically, your post about removing the glass from the OG Mars is what first inspired my investigation into the light cones in the first place.
The OG Mars (and OG Photon) optics were crazy; no lenses, 4 separate LED dies with 2-3 cm between them, and then surrounded by a shiny reflective square cone.
Hey, Jan.
I have a couple of questions:
“Note that the hot spots aren’t the LEDs, but the areas where the backlight of 4 neighboring lenses overlap.”
Did you mean here 4 neighboring LEDs overlap? You mentioned that you removed lenses for that measurement, so I was confused here. Or do you refer here to LEDs’ built-in lenses that are left after taking off external lenses? Did those LEDs had any lenses remaining after you took off those large glass lenses?
“This angle could be reduced by placing the LEDs further away, but then we would waste most of the LED power.”
But doesn’t that also mean that lensless LEDs that are placed further away from LCD will still cause overlap and hot spots? However, I do believe that by placing LEDs at a correct distance from LCD and without lenses, it should be possible to obtain quite uniform light based on your results though.
“This gives us a contrast ratio of about 1:75. Whether it is low or high, I cannot judge.”
Considering that DLP produce 1:20000 or 1:30000, that is quite low. But I once searched for LCD panels on Alibaba and some of those promise 1000-1500:1 contrast ratio. If that is actual property – I do not know and did not measure.
“bigger ray cone angle”
Could you explain, what did you mean by “ray cone angle” here?
Could you write a sample of drlcd compensate command with sample parameters? Could you also explain more “min” and “max” parameters?
– The measurement with hotspots is done without external lenses (the LEDs still have lenses). And it is the overlapping area of 4 LEDs.
– In that case, I wouldn’t place any lenses. I would just preserve the blinds between LEDs to keep their cones separate, and the blinds should go up to the LCD.
– Without measurement, we cannot know. Yes, DLP has a much bigger contrast ratio as it basically reflects the light outside the image. The question is – does it matter so much? Yes, it means that we all the time expose all resin, but with very tiny doses so it might not matter.
– It is the spread of light, which was measured in section “Measuring rays parallelity”
I am not sure there is much to explain. The min and max parameters just specify the range in the input that we should compensate for. It makes no sense to compensate for a few tiny hotspots (you would waste too much power compensating for it), similarly, it might make sense to ignore some small dark spots.
Regarding contrast ratio… It does matter. If contrast ratio is very low with very long prints those small doses can start producing ambient curing and after printing, when cleaning the VAT it is plausible to find blobs of resin at the bottom of the VAT. That was especially present with RGB screens earlier.
…that is even more plausible with very fast curing materials.
Hello, thanks for all of your articles. What do you think about using a UV USB camera? This isn’t technically a monochrome camera, but has been tuned to capture within the UV spectrum https://maxmax.com/maincamerapage/uvcameras/usb2-small. It has relatively low sensitivity, perhaps a long exposure can compensate, and you would image the entire screen at once.
Well the shop page describes the camera only being able to see to about 365nm-380nm… https://www.maxmax.com/shopper/product/15903-xniteusb2s-uv-usb-2-0-megapixel-hd-monochrome-camera-uv-only/category_pathway-9506
Is it possible to manually input measured values into DrLCD to get a mask output? I’m using the Chitu UV meter to measure UV values across a grid array over the screen.
I realize the simplicity of the the system you designed and how it automates the process, but it can also be a hurdle for those who cannot create the motorized setup. If we’re able to use DrLCD with manually inputted data, that would open up more options to create a UV mask.
Appreciate the help!
Yes, it is. The measurement from the motorized setup is a JSON file with the following structure:,,,
“`
{
“sensor”:
“size”:
“resolution”:
“measurements”:
}
“`
So an example could be:
“`
{
“sensor”: “TSL2561”,
“size”: [202, 130],
“resolution”: [5, 3],
“measurements”: [
[58, 12, 45, 18, 38],
[52, 12, 45, 18, 38],
[27, 12, 45, 18, 38]
]
“`
You can then process such file with DrLCD.
Hello Jan,
i try to reproduce this project with own mechanical construction.
My software (uv measure) output format is different, but I wrote a parse and now I can use your visualiser script.
Now I’m struggling with the compensation map script but it alwas give this error: “thresh.cpp:1659: error: (-210:Unsupported format or combination of formats) in function ‘cv::threshold'”. This error come from “locateScreenAutomatic” from “image.py”.
Have you any idea what is the problem?
Thank you for your help and for this article!
Ps: under this link are my test datas.
https://drive.google.com/drive/folders/1PTfyvNeyEdKCrJ9dK0S_x46Bi-GgJ8r1?usp=drive_link
I think the ultimate resolution of lcd printer is microled,lower power consumption,minimum angle of the light,much more contrast ratio.by the way is there a option for dr.lcd output a mask that can be applied to nanodlp